
Finding Value in a Concentrated Market
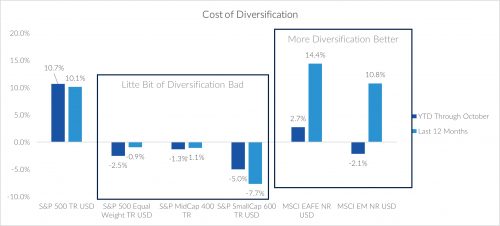
This year’s strong return for the S&P 500 through October belies the fact that it has not been a good year for most stocks. Indeed, the equal-weighted S&P 500 is down -2.5% while the headline market-cap-weighted version is up +10.7% over the same period. The Dow Jones Industrial Average, eschewed by many investment professionals but frequently quoted by the media, is up just 1.4%. With just a handful of large companies driving the return of the S&P 500, even a modest amount of diversification has detracted from performance for those investors who decided they did not want their fortunes to be determined by the idiosyncrasies of the so-called Magnificent Seven. Some may be tempted to jump onto the bandwagon, attracted to these big technology companies with instant brand recognition. For market historians, this prologue should be familiar and points toward a well-rehearsed epilogue whereby today’s winners become tomorrow’s losers.
We believe that this is an opportune time to remind readers of the inherent flaws of market-cap-weighted indices. While they provide valuable insight into explaining what’s worked well in the past, they’re typically poor predictors of what may work in the future. For example, only a few of the Nifty-50 stocks made famous in the 1970s are relevant today, and only one of the so-called Four Horsemen from the late 1990s has regained its 2000 closing high since then. The common mantra in equity investing is to “buy low, sell high,” but market-cap indices, which carry higher weights for more highly appreciated stocks and smaller weights for stocks that have decreased in value, encourage the opposite.
However, as eternal optimists (in investing, it’s far more pragmatic to be an optimist than a pessimist), we prefer to look at the opportunities offered from all parts of the market. Small-cap companies, for example, are trading at levels that are more than 25% below their 28-year median valuation and cheaper than they have been in 93% of the observations over that period. Mid-sized firms aren’t far behind. Certainly, there remain plenty of impelling valuation opportunities for investors – even within an index that on the surface appears overvalued.
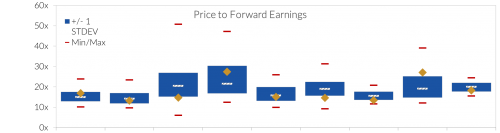
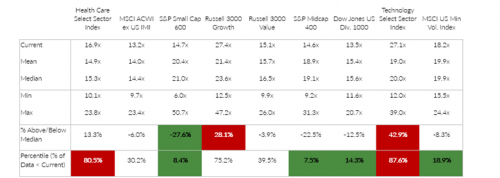
As of 9/30/2023. Price to Forward Earnings begins in 1995 for all segments except MSCI ACWI ex US IMI (data begins in 2009), Dow Jones US Div. 1000 (2011), Technology Select Sector Index (2006). Price to Forward Earnings reflect consensus earnings estimates for the next four quarters.
It may surprise many readers that the best source of diversification over the last 10-12 months has come from international markets. The 14.4% return of the MSCI EAFE has outpaced the S&P 500 on a trailing 12-month basis and has outperformed the more commonly used strategy of focusing diversification across sectors. Even beleaguered emerging market stocks have outpaced the average U.S. large cap stock this year, down only 2.1% versus the equal-weighted S&P 500’s 2.5% loss and providing an excellent source of diversification during the last twelve months.
Source: S&P, MSCI, and Morningstar
Diversification is hard. By its nature, a diversified portfolio contains both winner and losers. It is human nature to have short-term regrets about owning a loser. However, over longer periods of time (often measured in decades), a disciplined strategy provides a greater opportunity to practice the simplest of investment rules: buy low and sell high.